`;
Monitoring and log management
Know that systems are working before your users tell you they are not.
What this covers
IT operations monitoring with Prometheus, Nagios and Zabbix, and log management and analysis on the Elasticsearch, Logstash and Kibana stack.
We configure metrics, alerting thresholds and centralised logs so that alerts mean something and logs can actually be searched when something goes wrong. An alert that fires constantly is ignored within a week; the tuning is the part that makes monitoring useful.
What’s included
- Infrastructure and service metrics collection
- Alerting thresholds tuned to reduce noise
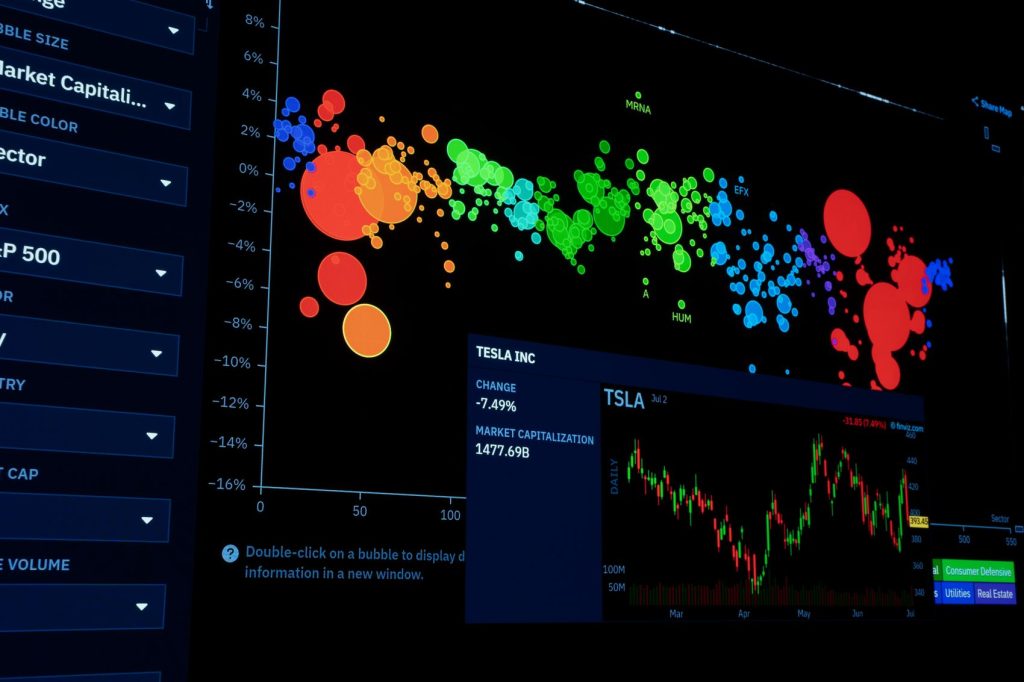
- Dashboards for operations and for management
- Centralised log collection and retention
- Log search and analysis on the ELK stack
- Integration with your incident process
Platforms and tools
PrometheusNagiosZabbixElasticsearchLogstashKibana
Related: Monitoring & Observability for end-to-end digital experience monitoring.
Every implementation can be backed by a 24/7/365 SLA support and maintenance agreement covering monitoring, incident response, configuration changes and platform updates, on-site or remote.
Need Monitoring and log management?
Tell us what you are running, or what you are planning to run, and our engineers will come back with a practical proposal.
Other infrastructure capabilities
Enterprise Linux implementationLinux server buildsShell scripting and automationLinux security and networkingRADIUS authenticationLinux and Windows integrationVirtualisation, HA and clusteringOpenStack private cloudCloud deployment and providersCI/CD and source controlContainers and KubernetesInfrastructure as codeOpenShift and Rancher